PAD Model Overview
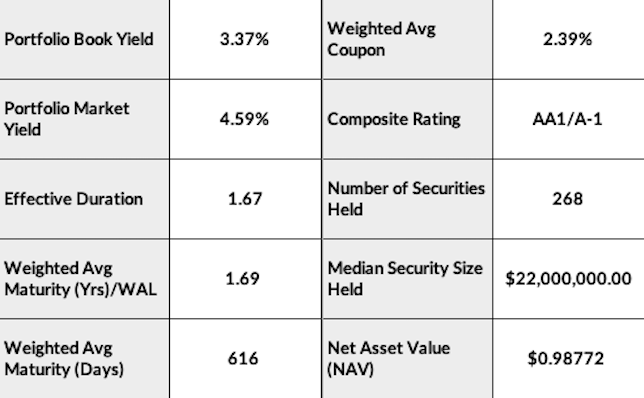
PAD is an immersive and robust portfolio analytics model that provides a balance-sheet look at all aspects of your portfolio. PAD can be used in coordination with an embedded strategy (e.g. PALS) and asset-liability manager to give public fund portfolio managers unprecedented insight into their investing and liquidity management needs. PAD provides an extensive management dashboard and provides portfolio summaries, compositions, cash flow projections, GASB 40 and 72 data and issuer/sector reports along with multiple bond and cash holdings breakdown reports. PAD can also provide extensive security level detail and compliance testing with individual investment policy constraints. PAD is truly an invaluable asset to have when managing cash flows and investments for your institution.
Portfolio Analytics
What sets MaxQ apart really starts to be apparent in the PAD model as users take a deep dive into their portfolio. Starting with the Management Dashboard, users quickly ascertain valuable information reflecting the current state of their portfolio and where improvements can be made. PAD contains built in asset-liability matching tools and incredibly rich detail such as liquidity, yield and sector allocation variances and earnings contribution breakdowns. This detail provides portfolio managers with the information they need to make intelligent and objective decisions regarding future transactions.


Cash and Security Holdings
PAD contains over a dozen different methods for viewing and reporting the cash and security holdings of the portfolio. These methods include formats broken down by sector, maturity, dealer, fund, issuer or ticker. PAD also contains a custom reporting mechanism that allows users to set constraints on the specific reporting variables. These constraints include variables like years to maturity, yield levels, gains and losses, specific tickers or sectors, call options and more! No matter how you decide to report it, MaxQ has you covered on reporting cash and securities in your portfolio.
Portfolio Reporting
PAD contains many other reporting elements such as issuer and maturity compliance monitors, portfolio composition breakdowns, aging reports and cash flow forecasting for interest and redemption payments. Users can also easily look up cash flow schedules or numerous other variables associated with a security such as description, classification, purchase and market data, step and call schedules and interest history. PAD also helps users with GASB related reporting by preparing GASB 40 and GASB 72 reporting data.


